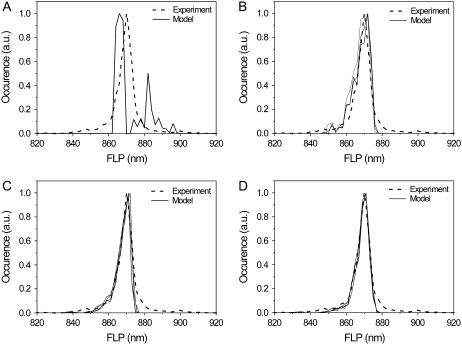
FIGURE 3.
The statistics of the fluorescence peak wavelength. Experimental statistics are obtained under 6.0 μW of the excitation intensity. Conformational transitions taken into account in the calculation are light-induced only. (A) T = 9, ΔE = 200 cm−1, λ = 280 cm−1. (B) T = 1, ΔE = 160 cm−1, λ = 280–320 cm−1. (C) T = 0.5, ΔE = 200 cm−1. λ = 280–340 cm−1. (D) T = 0.5, ΔE = 240–260 cm−1, λ = 360–380 cm−1.

