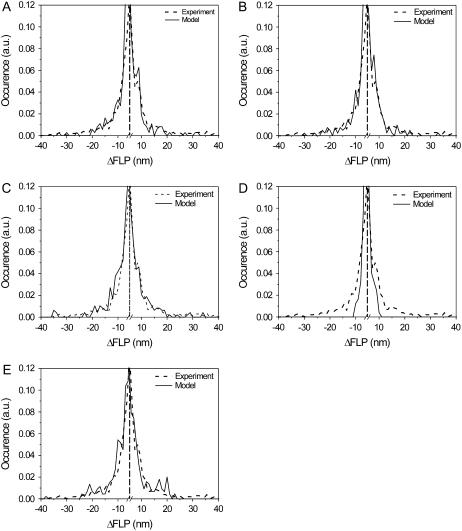
FIGURE 4.
Statistics of the FLP shifts. The experimental data are obtained under 6.0 μW excitation intensity. (A–C). Best results of the calculation. (D and E) Worst results are shown for comparison: distribution is too narrow when T is large (D) and it has excessively pronounced wings in the region of ∼20 nm when disorder values are too large (E). Parameters are (A) T = 0.5, ΔE = 200 cm−1, λ = 380 cm−1, (B) T = 0.33, ΔE = 220 cm−1, λ = 340 cm−1, (C) T = 0.5, ΔE = 220 cm−1, λ = 340 cm−1, (D) T = 2, ΔE = 100 cm−1, λ = 400 cm−1, and (E) T = 0.33, ΔE = 280 cm−1, λ = 340 cm−1. Vertical dashed line denotes break position.

