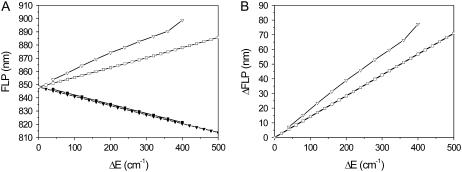
FIGURE 8.
FLP wavelength limits for the two-state model. (A) The reddest and bluest states were calculated on the assumption that all pigments are in state 1 (open squares) or 2 (solid squares). In such a case, the ring is homogeneous. The reddest (open triangles) and bluest (solid triangles) states without making this assumption were calculated with reorganization energy value λ = 380 cm−1 and an inhomogeneous ring. (B) The difference between the bluest and reddest calculated FLP values (homogenenous ring, squares; inhomogeneous ring, triangles).

