FIGURE 4.
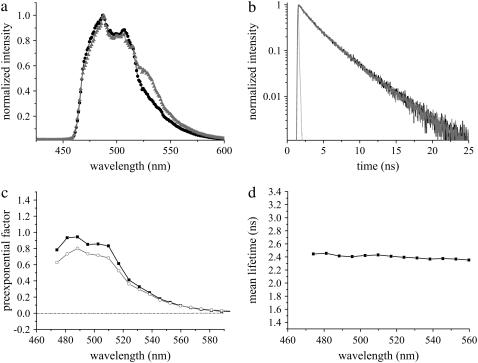
Fluorescence emission of Cerulean at 420 nm excitation in living COS-7 cells. (a) Comparison of fluorescence emission spectra of Cerulean alone (black) with coexpression of Cerulean and Citrine (shading). The fluorescence emission maximum for Cerulean was observed at 486 nm. A small Citrine component due to its high extinction coefficient was observed for the latter. (b) Fluorescence decay of Cerulean in the absence (black) and in the presence of Citrine (shading). IRF is shown in light shading. (c) DAS of Cerulean alone, which was unchanged in the presence of Citrine. Intensity decays were analyzed in 17 emission bands from 470 nm to 590 nm, and the preexponential factors of lifetimes τ1 (solid) and τ2 (shading) were plotted along the wavelength (Table 1). (d) Mean lifetimes of each emission band of Cerulean were plotted along the wavelength. Error bars are not shown due to their very small variability (<0.05 ns).

