FIGURE 5.
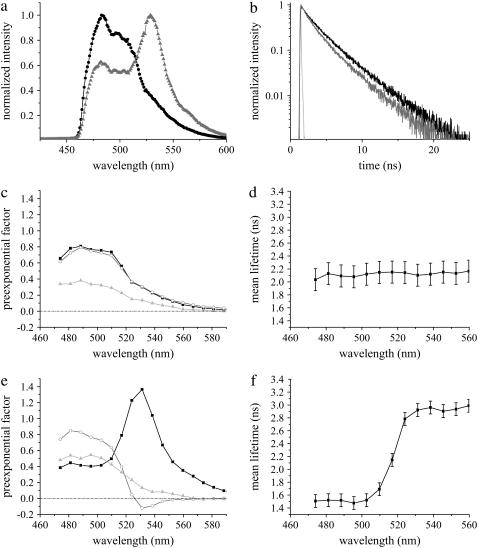
Fluorescence emission of Cerulean-Bsn1692-3263 in the absence and presence of Citrine-CtBP1 in living COS-7 cells. (a) Comparison of fluorescence emission spectra of Cerulean-Bsn1692-3263 (black) with the FRET sample (shading). A significant Citrine enhancement was observed in the presence of FRET. (b) Fluorescence decay of Cerulean-Bsn1692-3263 in the FRET sample (shading) was shorter compared to the control (black). IRF is shown in light shading. (c) DAS of control Cerulean-Bsn1692-3263. The preexponential factors of lifetimes τ1 (solid), τ2 (shading), and τ3 (light shading) were plotted along the wavelength (Table 1). (d) Mean lifetimes of each emission band were plotted along the wavelength for Cerulean-Bsn1692-3263. The variability between the cells is represented by error bars, which shows deviation due to the aggregating nature of the construct. (e) DAS of the FRET sample, Cerulean-Bsn1692-3263+Citrine-CtBP1. The preexponential factors of lifetimes τ1 (solid), τ2 (shading), and τ3 (light shading) (see Table 1) were plotted along the wavelength. Negative amplitudes were observed for τ2 at the acceptor emission maximum in the presence of FRET. (f) Mean lifetimes of each emission band were plotted with error bars along the wavelength for the FRET sample.

