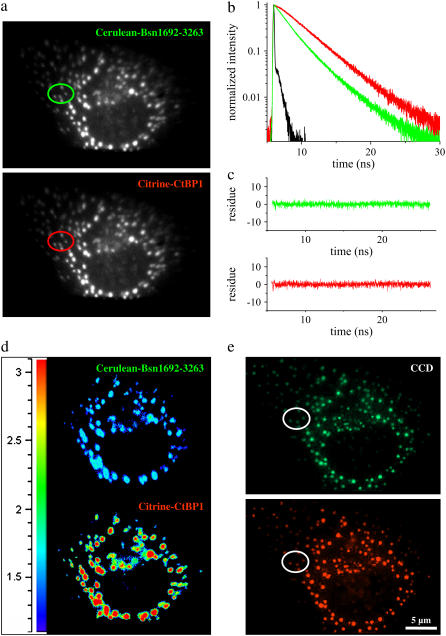
FIGURE 6.
COS-7 cells coexpressing Cerulean-Bsn1692-3263 and Citrine-CtBP1 measured by the imaging detector. (a) The fluorescence emission was split into Cerulean-Bsn1692-3263 and Citrine-CtBP1 emission bands as shown. Selected ROIs are indicated by colored circles. (b) Fluorescence decays from corresponding ROIs marked in a. In the presence of energy transfer, Cerulean-Bsn1692-3263 (green) showed short fluorescence decay with a simultaneous rise for Citrine-CtBP1 (red). IRF is shown in black. (c) The quality of the individual fits (donor-green, acceptor-red) is shown by the distribution of the residues. (d) The lifetime distribution map of the FRET sample. The lifetimes increased significantly from the donor (top) to the acceptor (bottom), indicated by the transition from blue to red in the lifetime scale. (e) In the corresponding fluorescence images from the CCD camera, the green and red spots denote the donor and acceptor channels, respectively.

