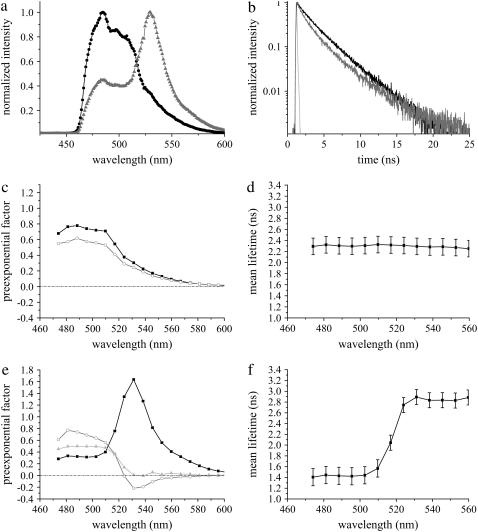
FIGURE 8.
Fluorescence emission dynamics of Cerulean-Bsn1692-3263 in the absence (n = 8) and presence (n = 5) of Citrine-CtBP1 at synapses of living neurons at DIV 16. (a) Comparison of fluorescence emission spectra of Cerulean-Bsn1692-3263 (black) with the FRET sample (shading). A significant Citrine enhancement was observed in the presence of FRET. (b) Fluorescence decay of Cerulean-Bsn1692-3263 in the FRET sample (shading) was shorter than the control (black). IRF is shown in light shading. (c) DAS of Cerulean-Bsn1692-3263 in living neurons. The preexponential factors of lifetimes τ1 (solid) and τ2 (shading) (see Table 3) were plotted along the wavelength. The preexponential factors showed only positive values. (d) Mean lifetimes of each emission band of Cerulean-Bsn1692-3263 was plotted along the wavelength. No deviations along the spectra were observed. (e) DAS of the FRET sample, Cerulean-Bsn1692-3263+Citrine-CtBP1. The preexponential factors of lifetimes τ1 (solid), τ2 (shading), and τ3 (light shading) (Table 3) were plotted along the wavelength. Negative amplitudes were observed for τ2 at the acceptor emission maximum in the presence of FRET. (f) The plot of mean lifetimes showed significant deviations along the wavelength in the presence of FRET.

