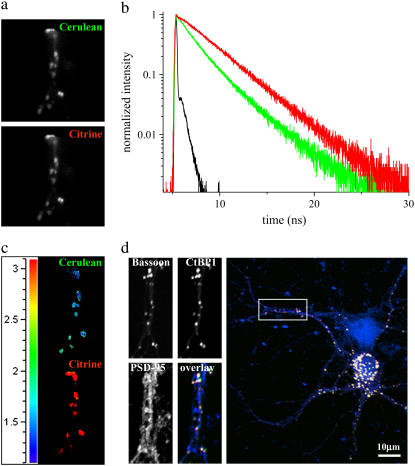
FIGURE 9.
Processes of hippocampal neurons at DIV 16 coexpressing Cerulean-Bsn1692-3263 and Citrine-CtBP1, as measured by the imaging detector. (a) The fluorescence emission was split into Cerulean-Bsn1692-3263 and Citrine-CtBP1 emission bands as shown. (b) In the presence of energy transfer, Cerulean-Bsn1692-3263 (green) showed a short fluorescence decay with a simultaneous rise for Citrine-CtBP1 (red) with negative amplitudes for τ2. IRF is shown in black. (c) The lifetime distribution map of the FRET sample. The lifetimes increased significantly from the donor (top) to the acceptor (bottom), indicated by the transition from blue to red in the lifetime scale. (d) The imaged cells were fixed and immunostained with antibodies against the postsynaptic marker protein Sap90/PSD-95, which identified the colocalized complexes of Bassoon and CtBP1 to be presynapses. Confocal images were obtained from similar regions as measured by FLIM. In the overlay image, Cerulean-Bsn1692-3263, Citrine-CtBP1, and PSD-95 are shown in green, red, and blue, respectively.

