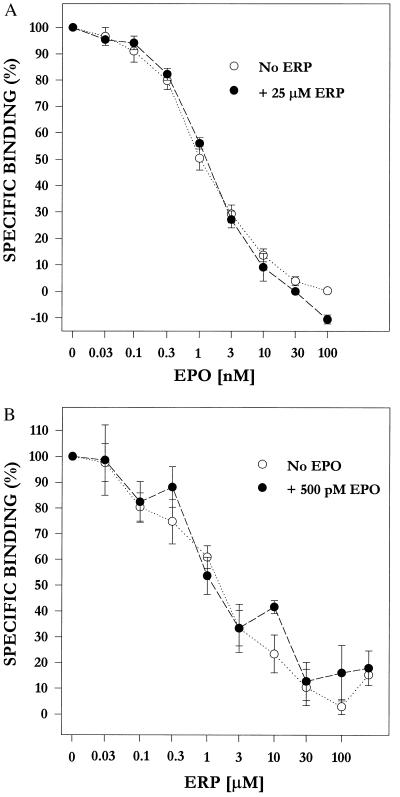
Figure 4.
Binding of EPO and ERP to EPO-R. (A) Competitive binding of [125I]EPO in the presence (closed symbols) and absence (open symbols) of 25 μM ERP. (B) Competitive binding of [125I]ERP in the presence (closed symbols) and absence (open symbols) of 500 pM EPO. See Materials and Methods for details. Data represent percent of maximum specific binding. The cell line shown expresses about 105 receptors per cell, as measured by binding of [125I]EPO or [125I]ERP. In contrast, the control cell line (see Materials and Methods) bound nearly undetectable amounts of [125I]EPO or [125I]ERP.

