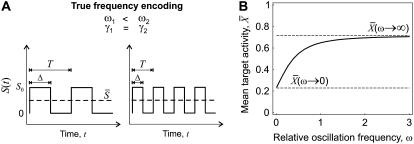
FIGURE 2.
Target activity is sensitive to the frequency of narrow calcium spikes. (A) True frequency encoding occurs when the relative frequency ω changes while both amplitude S0 and average  stay constant. (B) An example of true frequency decoding is shown here. The mean target activity
  is plotted against ω using Eq. 7. The values of
  in the limit of very slow and very fast oscillations (Eqs. 13 and 14, respectively) are indicated by dashed lines. Parameters: σ = 10, γ = 0.25.

