FIGURE 4.
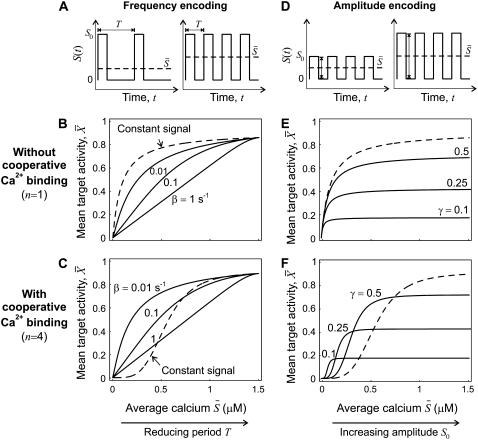
Encoding and decoding of Ca2+ frequency and amplitude. (A) Biological frequency encoding: Oscillation period T changes, and therewith the calcium average  while amplitude S0 remains constant. (B and C) Frequency decoding: Target activity
  in response to oscillatory (solid lines) or constant (dashed line) Ca2+ signals. For the oscillatory signal, the average Ca2+ concentration
  is increased by reducing the oscillation period T. (B and C) Correspond to noncooperative (n = 1) and cooperative (n = 4) calcium binding, respectively. (D) Biological amplitude encoding: Oscillation amplitude S0 changes, and therewith the calcium average
  while the period T remains constant. (E and F) Amplitude decoding: Target activity
  in response to oscillatory (solid lines) or constant (dashed line) Ca2+ signals. For the oscillatory signal,
  is changed by increasing the oscillation amplitude S0. Panels E and F correspond to noncooperative (n = 1) and cooperative (n = 4) calcium binding, respectively. Parameters:
  KS = 1 μM, S0 = 1.5 μM, Δ = 10 s; in panels B and C, β = 0.01, 0.1, 1/s; in panels E and F, β = 0.1/s, and γ = 0.1, 0.25, 0.5.

