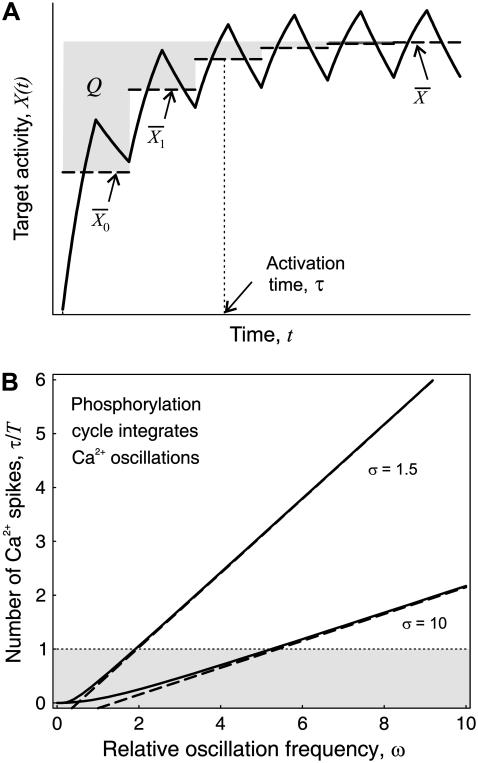
FIGURE 6.
Kinetics of target activation by Ca2+ oscillations. (A) Shown is the time course of the active target X in response to an oscillatory signal (solid line). The activation time τ (Eq. 21) measures how fast the target protein becomes activated. Depicted also are the mean target activity during each oscillation i (dashed line) and the equivalent of the numerator Q in Eq. 21 (shadowed area). (B) The ratio τ/T is plotted against the relative frequency ω using the general expression (solid line) given in Eq. 35, and the simplified solution (dashed line) in Eq. 22. Parameters: γ = 0.3, σ = 2, 10.

