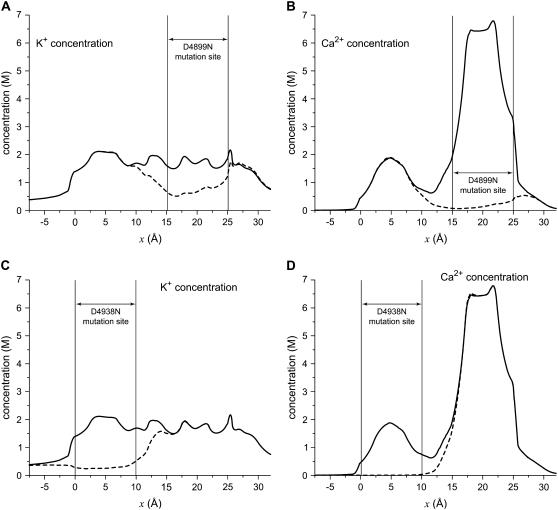
FIGURE 10.
Concentration profiles in the pore for the mutations D4899N (A and B) and D4938N (C and D) for K+ (A and C) and Ca2+ (B and D). The profiles for native (WT) channel are the solid lines and for the mutations the dashed lines. [K+] = 150 mM and [Ca2+] = 1 mM in both baths. In the model, the mutation is created by “turning off” the charge on the four Asp-4899s or the four Asp-4939s. The mutation site is the region from which the charge has been removed.

