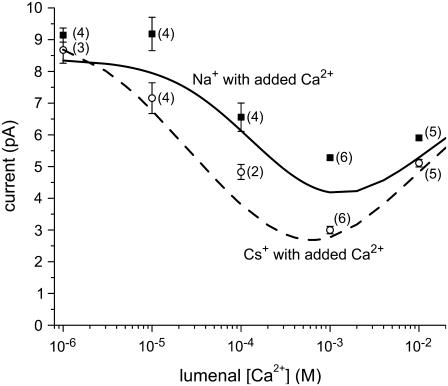
FIGURE 2.
Experimental verification of the AMFE predicted by the theory. The lines are the theory and the symbols are the experimental data with standard error bars and the number of experiments in parentheses. The solid line and symbols are the addition of Ca2+ to Na+ and the dashed line and open symbols are the addition of Ca2+ to Cs+. In all cases, the monovalent-chloride concentration was 100 mM in both cytosolic and lumenal baths and the indicated amount Ca2+ was added to the lumenal bath. The current at −20 mV is shown.

