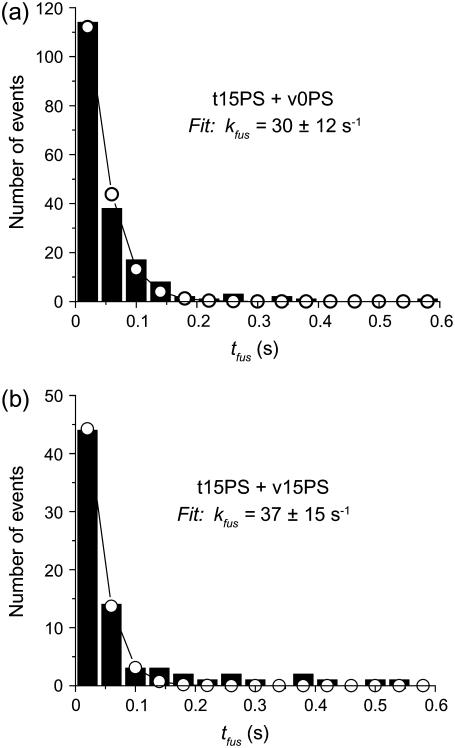
FIGURE 2.
Histogram of fusion times tfus on standard t-SNARE bilayers containing 15% DOPS for v-SNARE vesicles containing (a) no DOPS and (b) 15% DOPS. The numerically simulated best fit to the first three data bins (open circles) uses a single exponential kinetics model corrected to include effects of the finite camera frame time, as discussed in the text.

