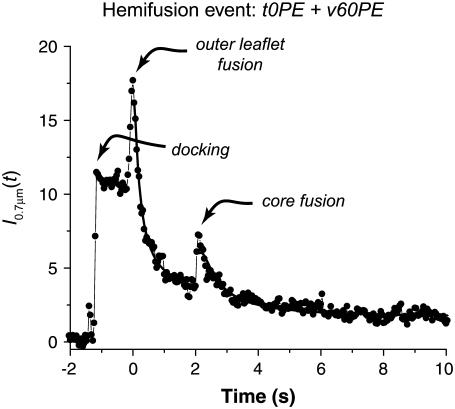
FIGURE 4.
An example of the integral fluorescence intensity time trace I0.7μm(t) for a hemifusion event. Dequenching of lipid labels occurs in two successive bursts. The solid line is a least-squares fit of the data by Eq. S4 with D1 = 0.85 μm2 s−1, D2 = 0.45 μm2 s−1, I2/(I1 + I2) = 0.31, and tcore = 2.08 s.

