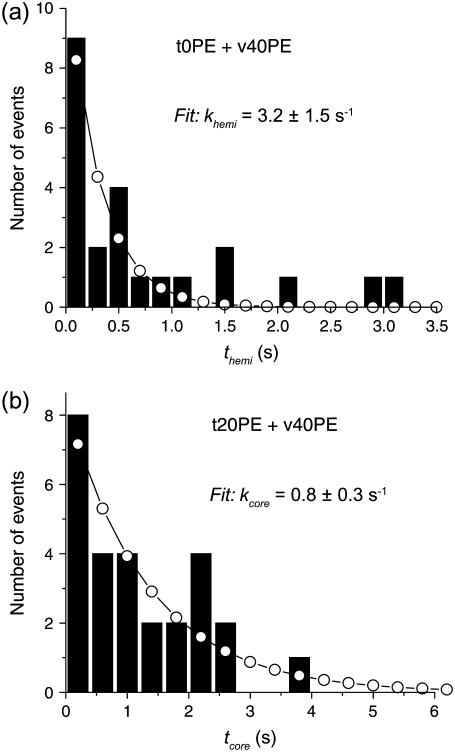
FIGURE 7.
(a) Histogram of themi for the t0PE + v40PE lipid composition. (b) Histogram of tcore for the t20PE + v40PE lipid composition. In these slowly decaying cases, open circles show the best fit by a single exponential decay. See Supplementary Material Figs. S5 and S6 for a histograms of themi and tcore for all lipid combinations.

