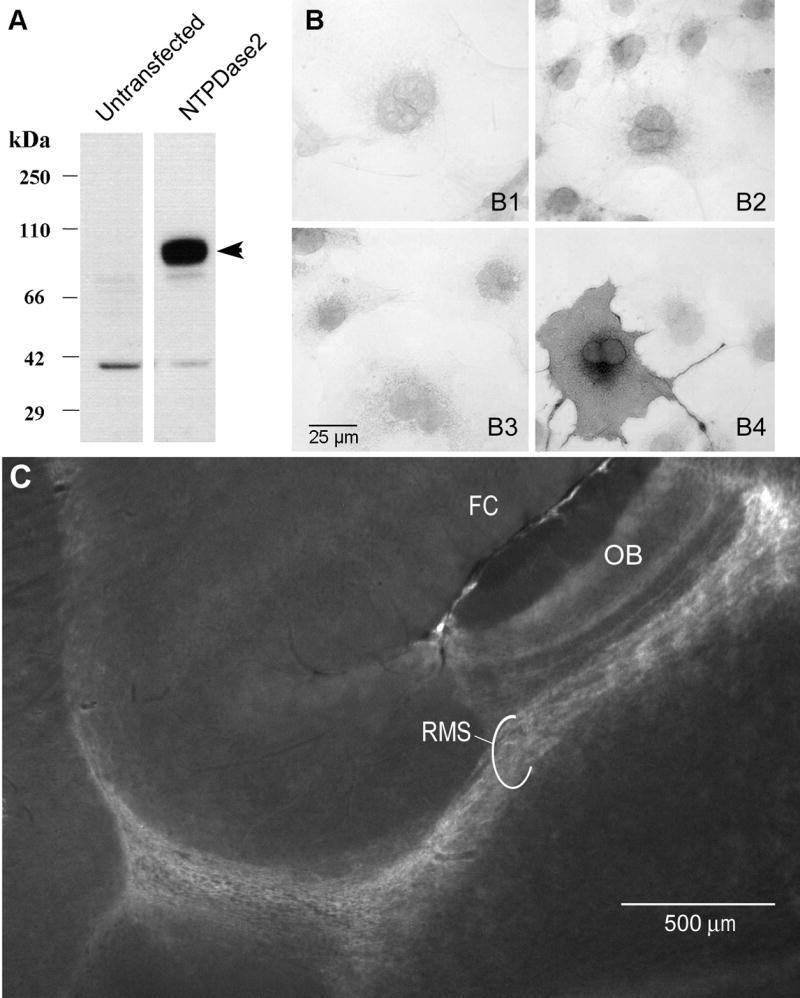
Figure 3.

Anti-NTPDase2 polyclonal antibody specificity A: Western blot analysis of lysate from untransfected COS-7 cells compared to lysate from COS-7 cells transfected with the expression vector plasmid containing the entire NTPDase2 cDNA. As expected, the transfected cells show a prominent band of ~75 kDa (arrowhead) confirming the presence of NTPDase2. B: Immunocytochemistry on intact COS-7 cells transfected (B3,B4) or untransfected (B1,B2) with NTPDase2 cDNA. Cells were incubated with the pre-immune serum (B1,B3) or the anti-NTPDase2 antibody (B2,B4). Immunoreactivity is present only with transfected cells incubated with the NTPDase2 antibody (B4). C: Immunofluorescence for NTPDase2 in a parasagittal brain section (anterior to the right) showing strong expression of NTPDase2 in the rostral migratory stream (RMS) connecting to the olfactory bulb (OB). Staining with this antibody correlates with the previously described distribution of NTPDase2 in the RMS (Braun et al., 2003). FC = frontal cortex.
