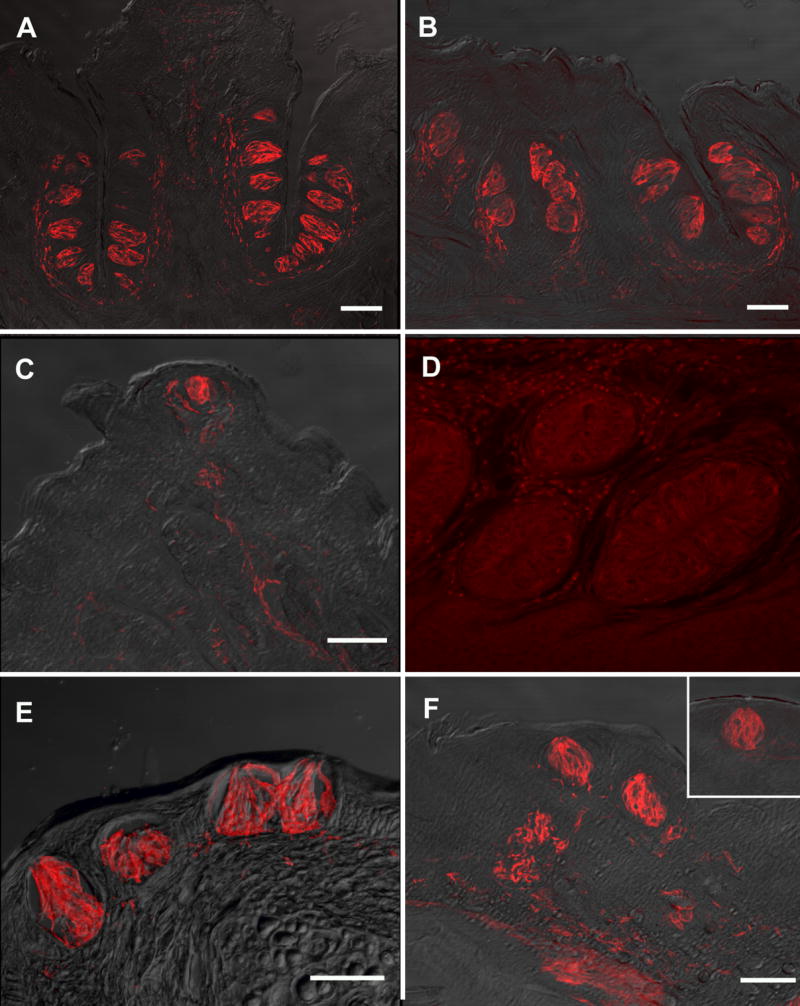
Figure 4.

Nomarski images overlaid with images showing for NTPDase2 in mouse taste buds and surrounding fibers. A: circumvallate papillae, B: foliate papillae, C: fungiform papillae, E: naso-incisor ducts, F: palate, insert: larynx. Incubation with the preimmune serum did not reveal any significant fluorescent signal in the foliate papillae shown in D (taken at eight times the exposure of the other panel figures). Scale bars = 50μm. Scale bar in F also applies to F insert and D.
