
Figure 2.
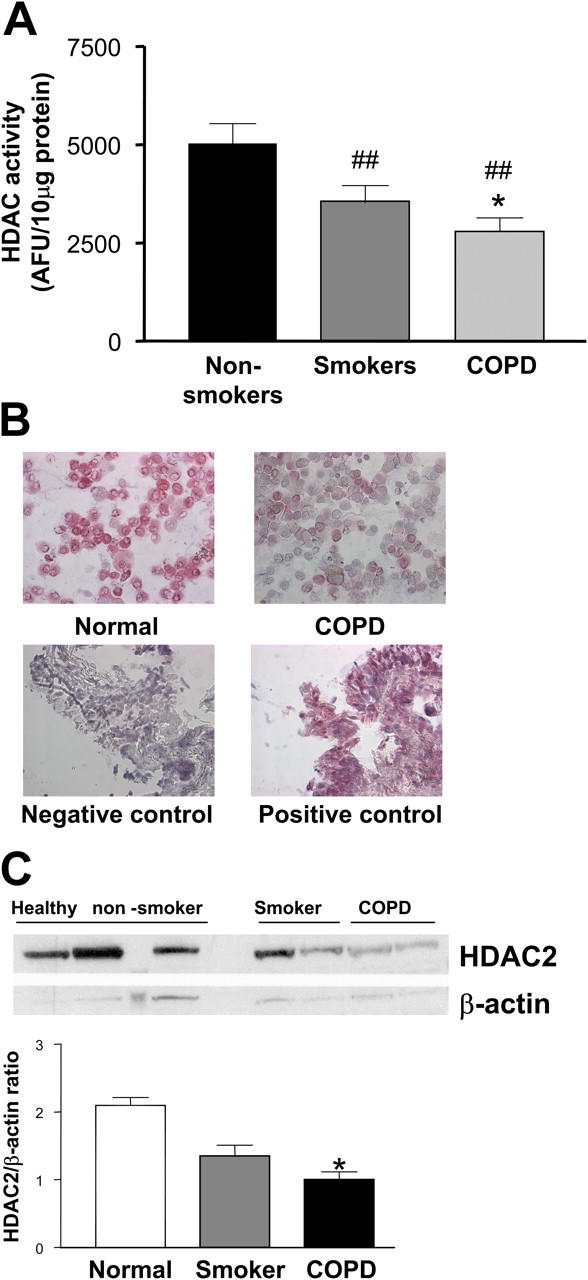
HDAC activity and expression in AM. (A) HDAC activity was measured in protein extracts from AM obtained from normal subjects, healthy smokers, and COPD patients and expressed according to protein content. ##P < 0.01 versus nonsmoker; *P < 0.05 versus smoker; n ≥ 6 in each group. (B) Immunocytochemical analysis of HDAC2 expression in AM from normal subjects and patients with COPD. Results are representative of at least six subjects in each group. (C) Western blot analysis of HDAC2 expression in AM from normal subjects, healthy smokers, and COPD patients and expressed according to protein content. *P < 0.05 versus nonsmoker, n = 3 in each group.