Figure 1.
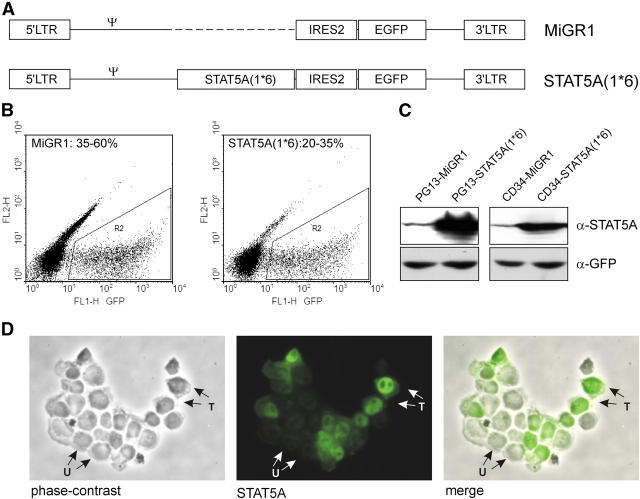
Retroviral introduction of STAT5A(1*6) into human CB CD34+ cells. (A) Schematic representation of the MiGR1 and STAT5A(1*6) retroviruses used in this study. (B) CB CD34+ cells were prestimulated for 48 h in QBSF supplemented with KL, FL, and TPO (100 ng/ml) followed by three transduction rounds in the next 48 h with STAT5A(1*6) or MiGR1 retroviruses, after which transduction efficiencies were determined on the basis of GFP expression using FACS. (C) Western blot of total extracts from PG13 retroviral producer cell lines and transduced CB CD34+ cells as described above. Membranes were probed with α-STAT5 and α-GFP antibodies. (D) Cytospins of transduced CB CD34+ cells. Cytospins were fixed and permeabilized as described in Materials and Methods and stained with α-STAT5 antibodies. Transduced cells (T) appear as bright green with a predominantly nuclear localization of STAT5, whereas the untransduced cells (U) appear as dim.

