
Figure 4.
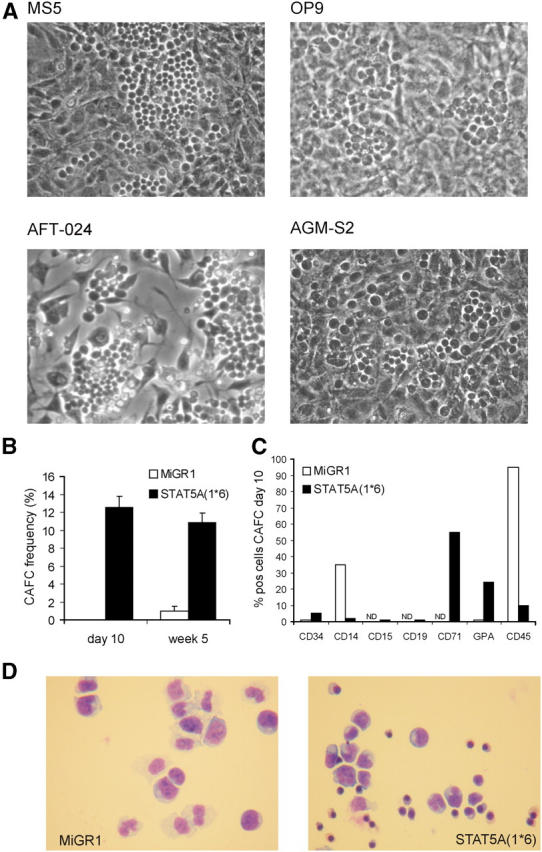

STAT5A(1*6) induces early CAFCs in CB CD34+ cells. CB CD34+ cells were transduced with MiGR1 or STAT5A(1*6) as described in Fig. 1 and grown in cocultures on stromal cell lines as indicated. (A) Representative examples of CAFCs at day 10 observed in coculture studies with CB CD34+ cells transduced with STAT5A(1*6). (B) CAFC frequencies were determined on MS5 in limiting dilution conditions as described in Materials and Methods. (C) GFP+ cells were sorted from the adherent population on MS5 at day 10 and used for FACS analysis and cytospins (D). (E) CB CD34+ cells were transduced with MiGR1 or STAT5A(1*6), after which the CD38high and CD38low populations were sorted and used to determine the CAFC frequencies on MS5 under limiting dilution conditions. First CAFC frequencies were determined at day 10, and cultures were either harvested and plated on new MS5 stroma to determine secondary CAFC frequencies (indicated in black as number of secondary CAFCs/number of primary CAFCs), or plated in methylcellulose to determine the number of CFCs/10 CAFCs (F). (G) CB CD34+ cells were transduced with MiGR1 or STAT5A(1*6) as described in Fig. 1 and plated for CFC assays in triplicate. After 2 wk, the colonies were scored and cells from each plate were plated for secondary CFCs. (H) Sublethally irradiated NOD-SCID recipients were injected with 2 × 10⁵ GFP+ day 10 STAT5A(1*6) CAFCs. Mice were killed at week 6 and the bone marrow was analyzed as indicated.