Figure 6.
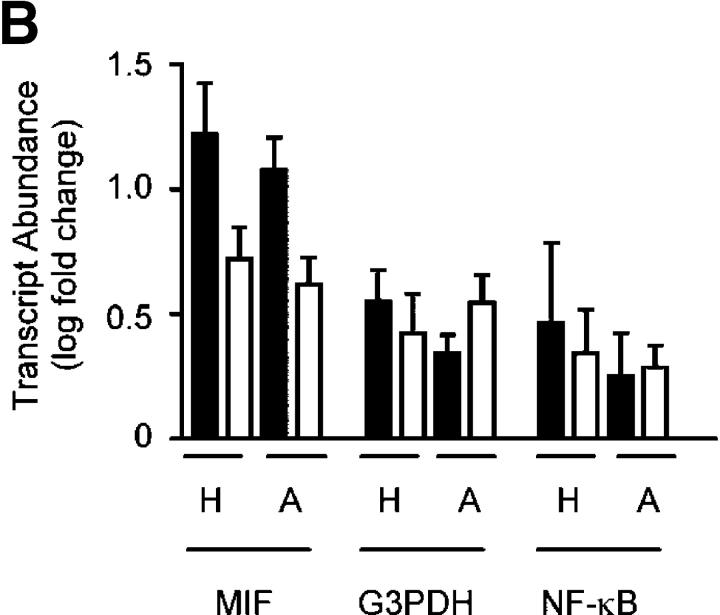
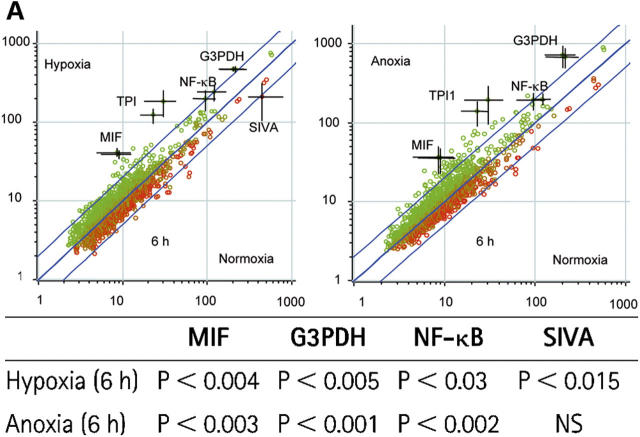
Hypoxia regulates human neutrophil transcript abundance. (A) Regulation of transcript abundance. Log (base 10) mean signal intensities were calculated and compared from array filters prepared using RNA from human peripheral blood neutrophils cultured under the oxygen tensions shown. Points represent the mean (±SEM bars) of n = 3 experiments; each gene is presented in duplicate. Outer lines represent a twofold change between conditions. All significant transcripts are individually named. The table shows the statistical analysis of the gene array data. Cyber-T tests were performed to calculate the Bayesian p values shown. (B) TaqMan confirmation. Array findings (open bars) were validated for hypoxia (H), and anoxia (A) by TaqMan analysis of duplicate RNA samples (shaded bars) using the nonchanging endogenous control CSF3R (granulocytes). Data represent mean ± SEM of n = 3 experiments.


