
Figure 4.
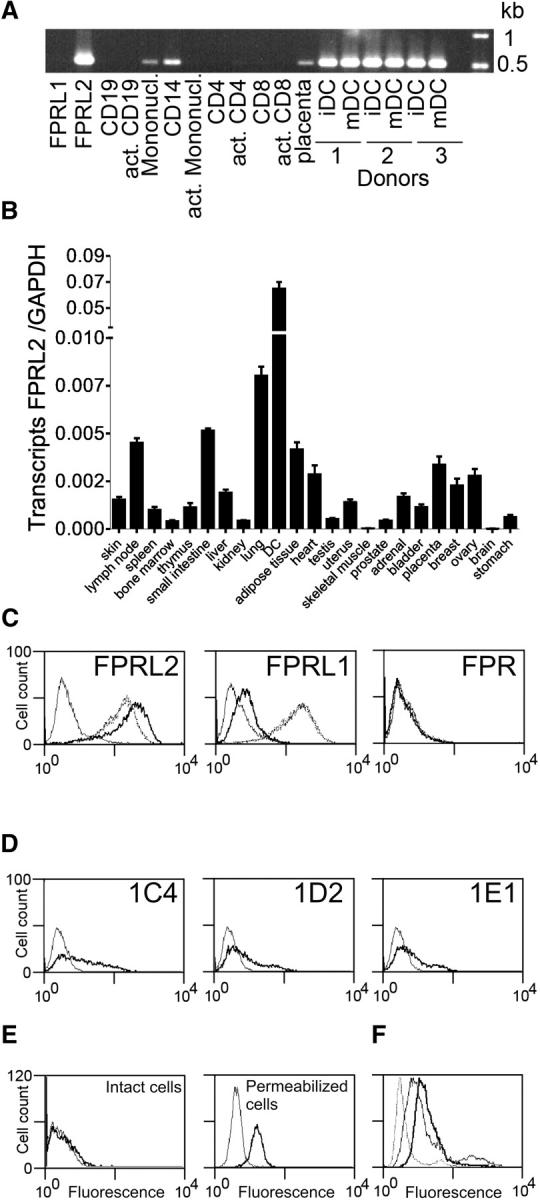
Expression profile of human FPRL2. (A) Transcripts encoding human FPRL2 were amplified by RT-PCR in a set of human leukocyte populations. act., activated; Mononucl., mononuclear cells; iDC, immature DCs; mDC, mature DCs. (B) Distribution of FPRL2 in a set of human tissues by using quantitative RT-PCR (Taqman). The data were normalized for the expression of GAPDH used as control. (C) Anti-FPRL2 monoclonal antibodies were characterized by FACS on CHO-K1 cells expressing FPR, FPRL1, and FPRL2. Bold solid line, 1C4; dotted line, 1D2; dashed line, 1E1; thin solid line, control labeling (IgG2a). The profiles of 1D2 and 1E1 are superimposed and cannot therefore be distinguished. (D) The expression of FPRL2 was analyzed by FACS on immature DCs using the three monoclonal antibodies. Bold solid line, anti-FPRL2 antibodies; thin solid line, control labeling (IgG2a). (E) Expression of FPRL2 on intact and permeabilized DCs using 1C4. Bold solid line, 1C4; thin solid line, control labeling (IgG2a). (F) Expression of FPRL2 on immature (bold solid line) and mature (thin solid line) DCs using 1D2. Dotted lines, control labeling (IgG2a).