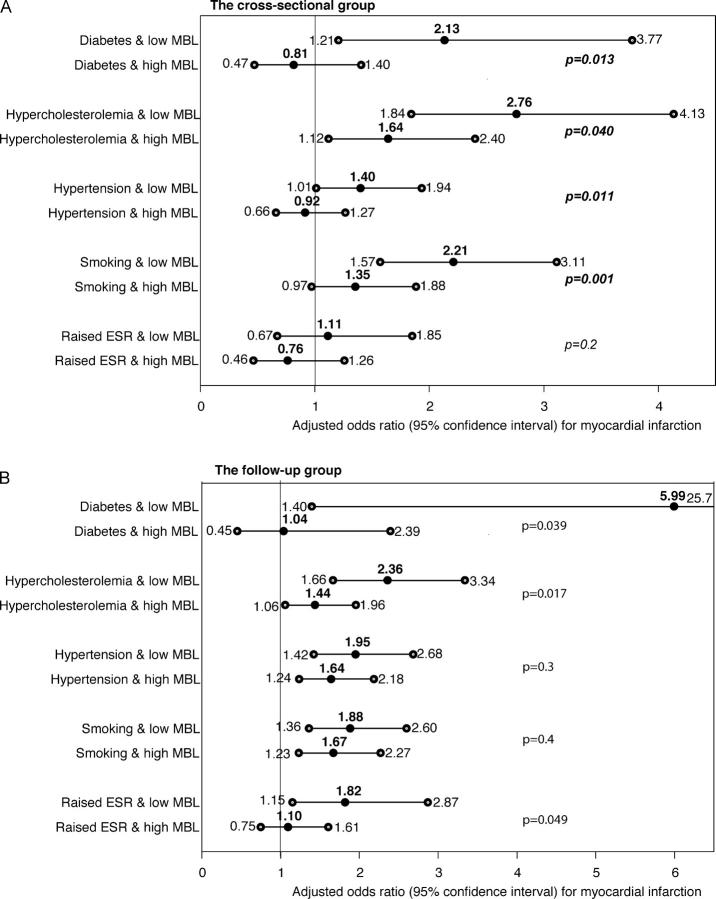
Figure 5.
Risk of MI in individuals with different risk factors categorized into subgroups according to their MBL levels (above or below 1,000 μg/L) and compared with all the individuals without that risk factor, independent of their MBL level. (A) The cross-sectional group and (B) the follow-up group. Odds ratio estimates from a multiple logistic regression model adjusted for the same variables as in Fig. 2. The p-values indicate the significance of the difference between the subgroups. The definition of risk factors is described in Materials and Methods, and the number of participants with each risk factor is shown in Figs. 2 and 4.

