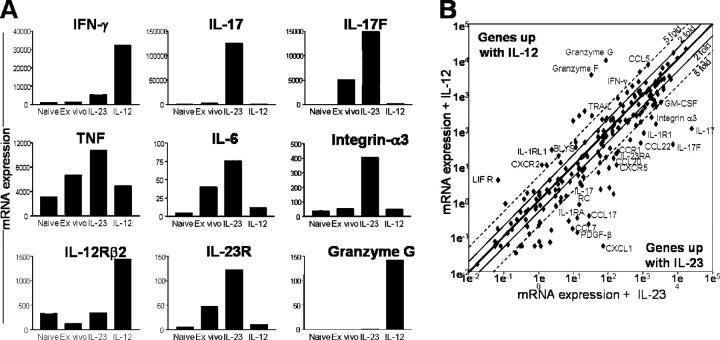
Figure 4.
Gene expression analysis of IL-23 versus IL-12 driven T cells. (A) Quantitative analysis of mRNA expression levels of selected genes, comparing sorted CD4+ DLN cells isolated from PLP-immunized mice, either not cultured (ex vivo) or cultured with rIL-23 or rIL-12 for 10 d. (B) Quantitative analysis of mRNA expression levels of >200 selected genes, comparing total DLN cells isolated from PLP-immunized mice, cultured with either rIL-23 or rIL-12 for 10 d. All samples were activated with PMA/ionomycin for 4 h before RNA extraction and Taqman analysis. Results are normalized to a housekeeping gene, ubiquitin, and representative of two similar experiments.

