
Figure 2.
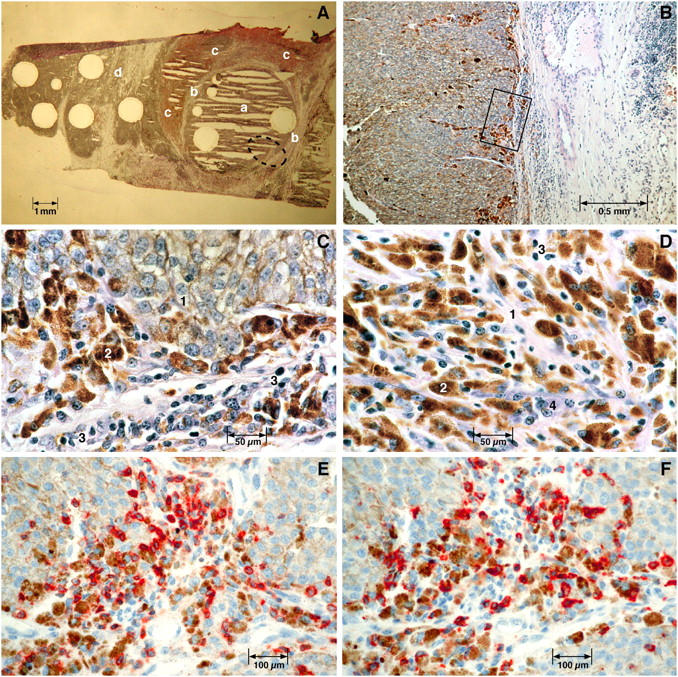
Analysis of the invaded lymph node resected in April 2000. (A) Overall structure presented on a cryosection stained with hematoxylin. A circular area of living tumor cells (a) is surrounded by a fibrous band (b). Above, a crescent-shaped region (c) is devoid of tumor cells. Numerous macrophages containing melanin and other inflammatory cells are present in this region (see D). The area on the left part of the section (d) represents the uninvaded part of the lymph node. The stippled ellipse indicates the localization of the area shown in B. The 1-mm holes represent samples collected by laser microdissections for gene expression analysis. (B–F) Paraffin-embedded sections stained with hematoxylin and (B–D) eosin. (B) Higher magnification of an area straddling the living tumor cell region and the fibrous band, which is infiltrated with lymphocytes. Macrophages containing melanin are located at the outer rim of the tumor cell region. The rectangle delineates the area shown in C. (C) Further enlargement of the border between tumor cells (1) and the fibrous band, which contains macrophages with melanin accumulation (2) and lymphocytes (3). (D) Higher magnification of region c (A) with fibroblasts (1), macrophages with melanin (brown-colored; 2), lymphocytes (3), and plasmocytes (4). (E and F) Adjacent sections treated with anti-CD3 (E) and anti-CD8α antibodies (F). T cells infiltrating the tumor are stained in red (immunoperoxidase). Macrophages with melanin are brownish.