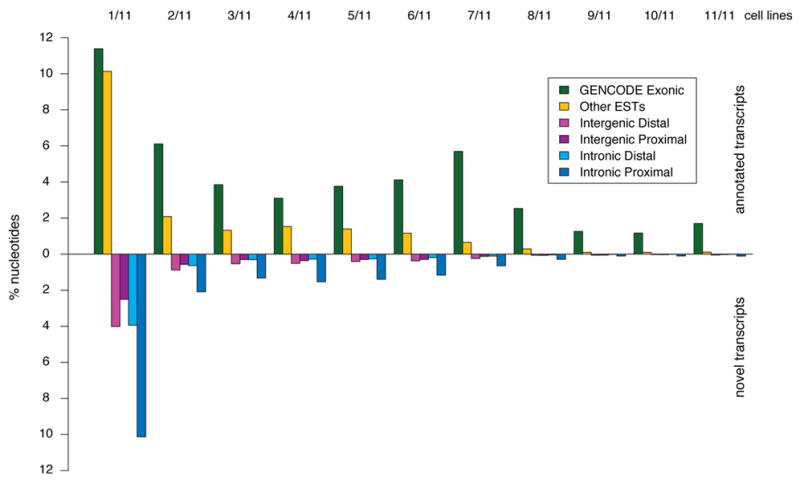
Figure 1.

Annotated and unannotated TxFrags detected in different cell lines. The proportion of different types of transcripts detected in the indicated number of cell lines (from 1/11 at the far left to 11/11 at the far right) is shown. The data for annotated and unannotated TxFrags are indicated separately, and also split into different categories based on GENCODE classification: Exonic, Intergenic (Proximal being within 5 kb of a gene and Distal being otherwise), Intronic (Proximal being within 5 kb of an intron and Distal being otherwise), and matching other ESTs not used in the GENCODE annotation (principally because they were unspliced). The y-axis indicates the percent of tiling array nucleotides present in that class for that number of tissues.
