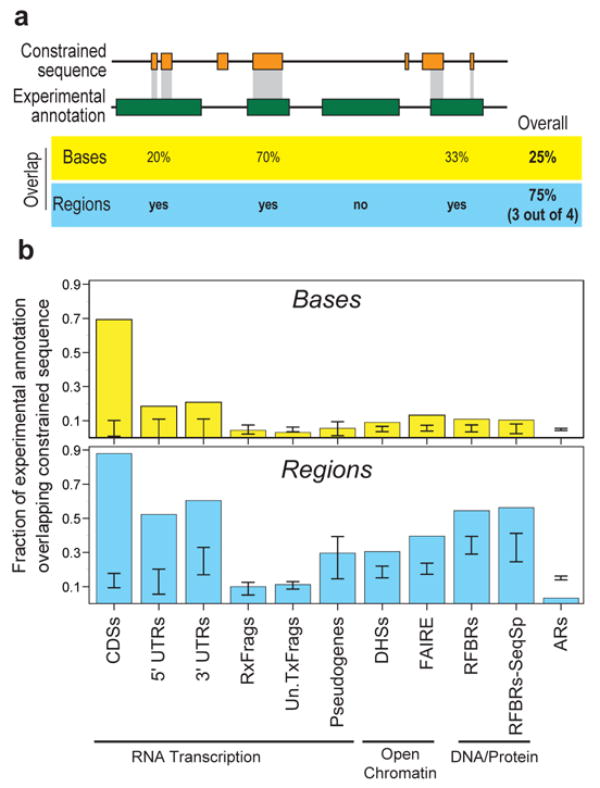
Figure 11.

Overlap of constrained sequences and various experimental annotations. (a) A schematic depiction shows the different tests used for assessing overlap between experimental annotations and constrained sequences, both for individual bases and for entire regions. (b) Observed fraction of overlap, depicted separately for bases and regions. The results are shown for selected experimental annotations. The internal bars indicate 95% confidence intervals of randomised placement of experimental elements using the GSC methodology to account for heterogeneity in the datasets. When the bar overlaps the observed value one cannot reject the hypothesis that these overlaps are consistent with random placements.
