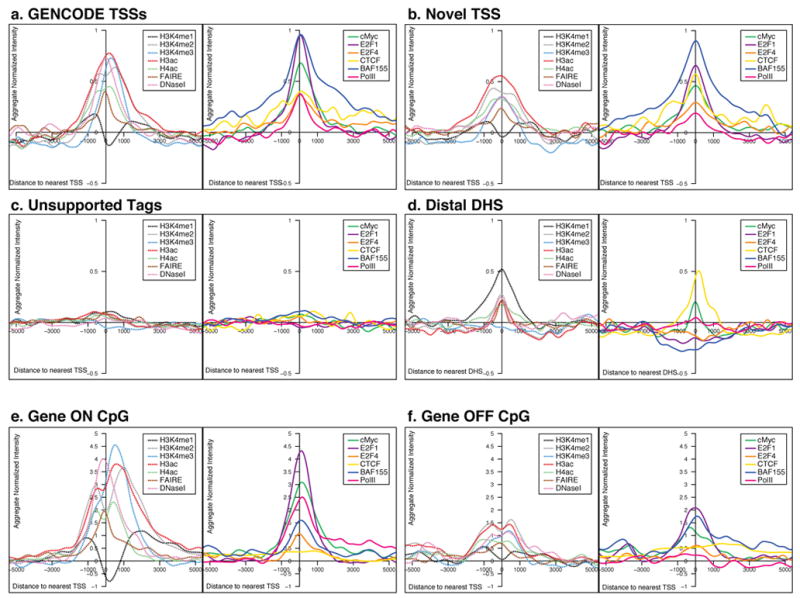
Figure 5.

Aggregate signals of tiling-array experiments from either ChIP-chip or chromatin structure assays, represented for different classes of TSS and DHS. For each plot, the signal was first normalised with a mean of 0 and standard deviation of 1, and then the normalised scores were summed at each position for that class of TSS or DHS and smoothed using a kernel density method (see Supplementary Information section S3.6). For each class of sites there are two adjacent plots. The left hand plot depicts the data for general factors: FAIRE and DNaseI sensitivity as assays of chromatin accessibility and H3K4me1, H3K4me2, H3K4me3, H3ac, and H4ac histone modifications (as indicated); the right hand plot shows the data for additional factors, namely cMyc, E2F1, E2F4, CTCF, BAF155, and PolII. The columns provide data for the different classes of TSS class or DHS (unsmoothed data and statistical analysis shown in Supplementary Information section S3.6).
