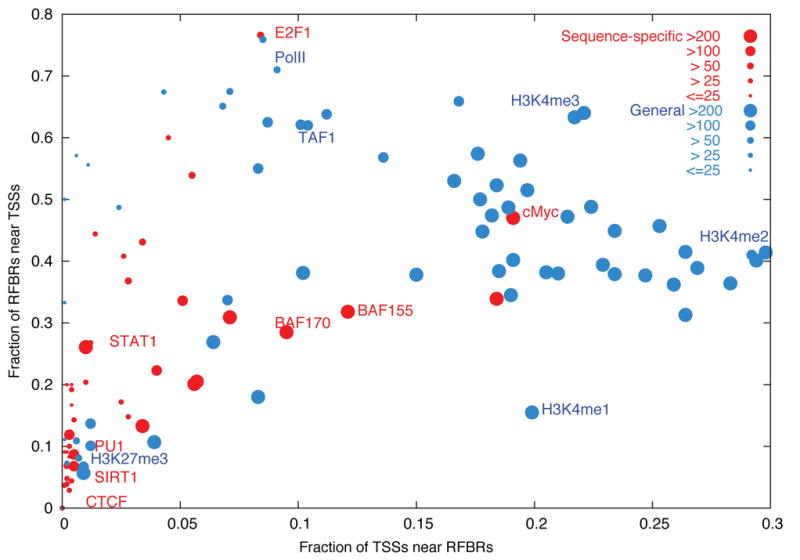
Figure 6.

Distribution of RFBRs relative to GENCODE TSSs. Different RFBRs from Sequence Specific factors (Red) or general factors (Blue) are plotted showing their relative distribution near TSSs. The x-axis indicates the proportion of TSSs close (within 2.5KB) to the specified factor. The y-axis indicates the proportion of RFBRs close to TSSs. The size of the circle provides an indication of the number of RFBRs for each factor. A handful of representative factors are labelled.
