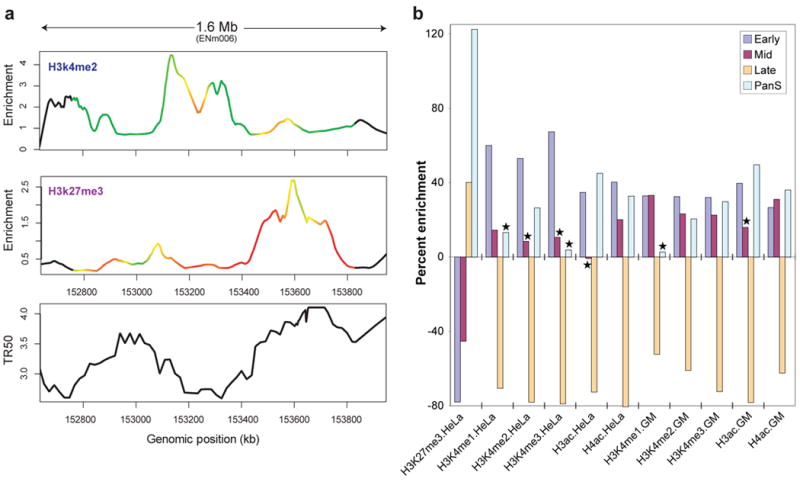
Figure 7.

Correlation between replication timing and histone modifications. (a) Comparison of two histone modifications (H3K4me2 and H3K27me3), plotted as enrichment ratio from the Chip-chip experiments and the time for 50% of the DNA to replicate (TR50), indicated for ENCODE region ENm006. The colours on the curves reflect the correlation strength in a sliding 250 kb window. (b) Differing levels of histone modification for different TR50 partitions. The amounts of enrichment or depletion of different histone modifications in various cell lines are depicted (indicated along the bottom as ‘Histone mark.Cell line’; GM= GM06990). Asterisks indicate enrichments/depletions that are not significant based on multiple tests. Each set has four partitions based on replication timing: Early, Mid, Late, and PanS.
