Figure 8.

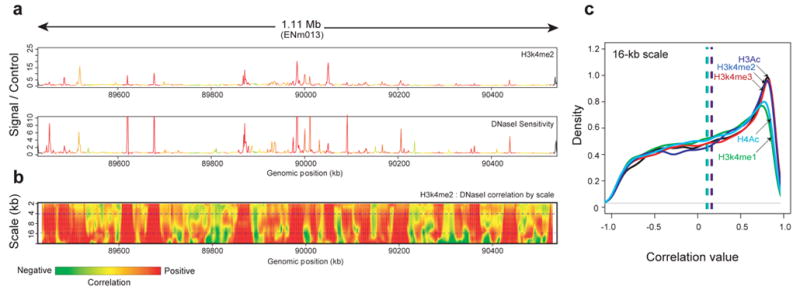
Wavelet correlations of histone marks and DNaseI sensitivity. As an example, correlations between DNaseI sensitivity and H3K4me2 (both in the GM06990 cell line) over a 1.1-Mb region on chromosome 7 (ENCODE region ENm013) are shown. (a) The relationship between histone modification H3K4me2 (upper plot) and DNaseI sensitivity (lower plot) is shown for ENCODE region ENm013. The curves are coloured with the strength of the local correlation at the 4-kb scale (top dashed line in panel b). (b) The same data as in a are represented as a wavelet correlation. The y-axis shows the differing scales decomposed by the wavelet analysis from large to small scale (in kb); the colour at each point in the heatmap represents the level of correlation at the given scale, measured in a 20-kb window centered at the given position. (c) Distribution of correlation values at the 16-kb scale between the indicated histone marks and. The x-axis shows different correlation values. The Y-axis is the density of these correlation values across ENCODE; all modifications show a peak at a positive-correlation value.
