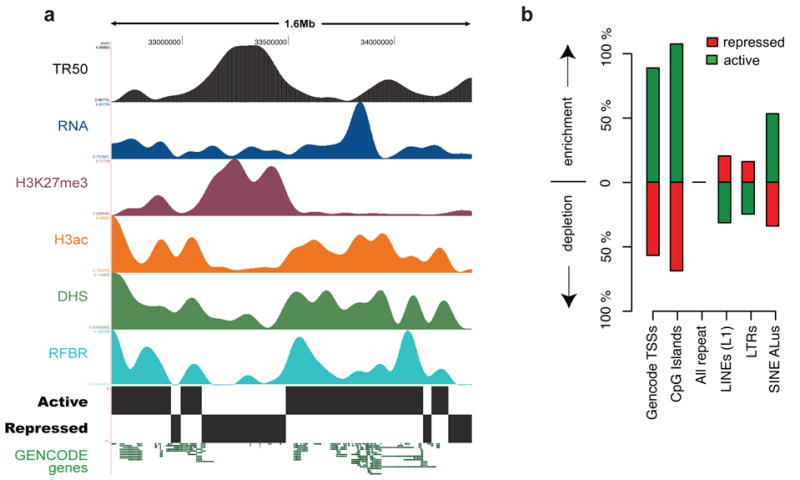
Figure 9.

Higher-order functional domains in the genome. The general concordance of multiple data types is illustrated for an illustrative ENCODE region (ENm005). (a) Domains were determined by simultaneous HMM segmentation of replication time (TR50; black), bulk RNA transcription (blue), H3K27me3 (purple), H3ac (orange), DHS density (green), and RFBR density (light blue) measured continuously across the 1.6-Mb ENm005. All data were generated using HeLa cells. The histone, RNA, DHS, and RFBR signals are wavelet-smoothed to an approximately 60 kb scale (see Supplementary Information section S4.7). The HMM segmentation is shown as the blocks labeled “active” and “repressed” and the structure of GENCODE genes (not used in the training) is shown at the end. (b) Enrichment or depletion of annotated sequence features (GENCODE TSSs, CpG islands, different types of repetitive elements, and non-exonic CSs) in active versus repressed domains. Note the marked enrichment of TSSs, CpG islands, and Alus in active domains, and the enrichment of LINE and LTRs in repressed domains.
