Figure 6.
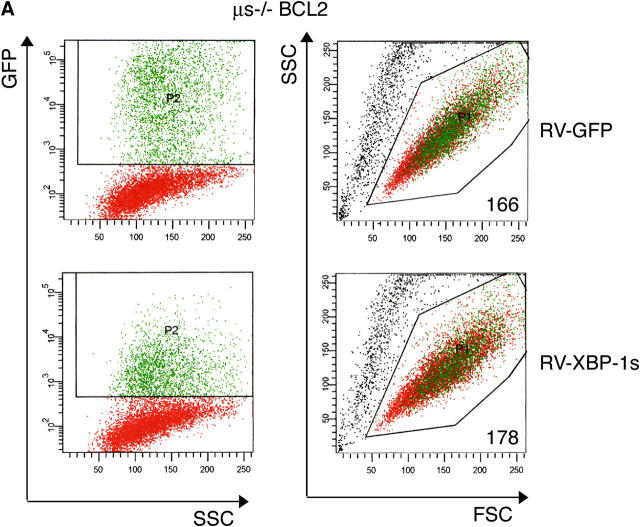
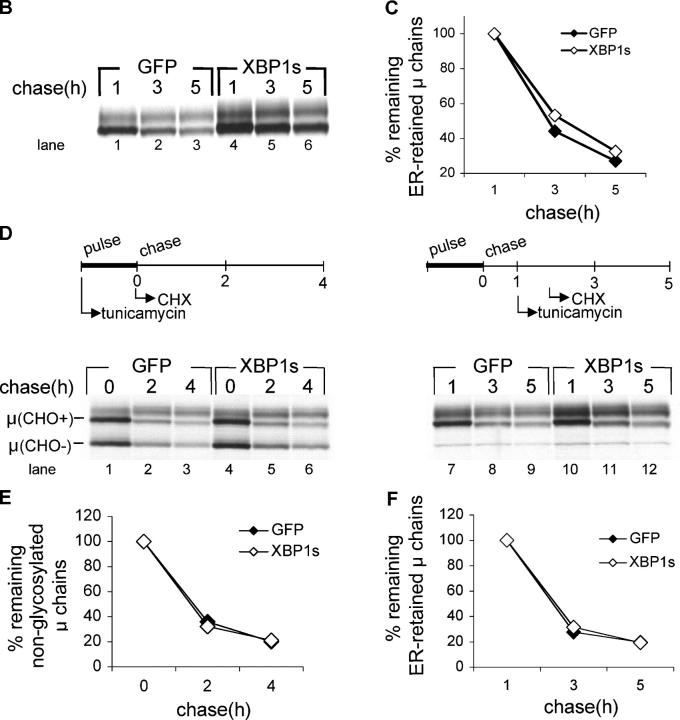
XBP-1 does not affect degradation of endogenous membrane μ. B cells stimulated for 24 h with CpG and transduced with XBP-1s-IRES-GFP or IRES-GFP encoded retroviruses. 1 d later, the GFP-positive population was sorted, and plated for 2 d in the presence of LPS. (A) Flow cytometry analysis was performed at the time of sorting (∼18 h after infection). GFP-positive B cells are depicted in green. The mean forward scatter of GFP the positive population is indicated. (B) Equal numbers of live cells were pulse-labeled with [35S]methionine for 30 min and chased for up to 5 h. μ-chains were immunoprecipitated and analyzed as above. (C) Autoradiograms were quantified by phosphoimager, and the relative amount of μ to the 1-h time point was calculated. (D) μs −/− BCL2 B cells were stimulated and infected as in (A). Tunicamycin (1 μg/ml) was added during the pulse-labeling period (left), or immediately after removal of the 1-h chase point (right period). Cycloheximide was added at the initiation of the chase (left) or 45 min after tunicamycin addition (right). M-chains were immunoprecipitated and analyzed as above. (E) Autoradiograms were quantified by phosphoimager, and the relative amount of nonglycosylated μ to the zero time point was calculated. (F) Autoradiograms were quantified as above and the relative amount of immature μ to the 1-h time point was calculated.


