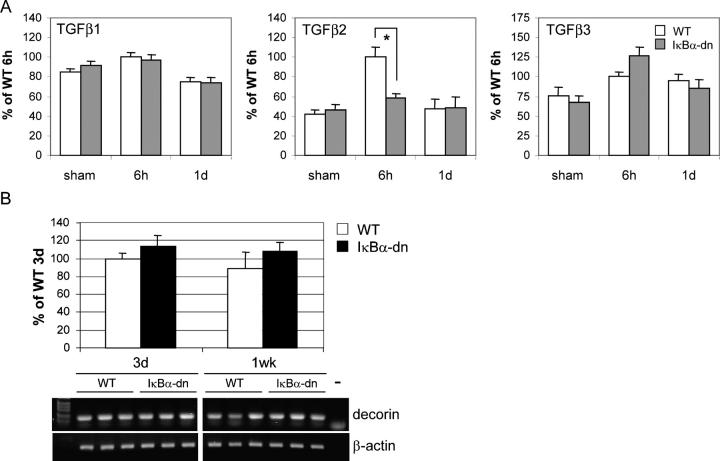
Figure 6.
Expression of TGF-β and decorin in WT and GFAP-IκBα-dn mice after SCI. (A) Gene expression of TGF-β1, -β2, and -β3 6 h and 1 d after SCI was measured by RPA. Semiquantitative measurements were obtained by normalizing to GAPDH and L32. Results are expressed as the percentage of WT 6 h after SCI and represent the mean ± SEM (n = 4). *, P < 0.05, as determined by one-way ANOVA and the Tukey test. (B) Decorin expression 3 d and 1 wk after SCI was measured by real-time RT-PCR and normalized to β-actin. Results are expressed as the percentage of WT 3 d after SCI and represent the mean ± SEM (n = 3). Samples were also analyzed by agarose gel electrophoresis. −, negative control for the PCR.

