
Figure 5.
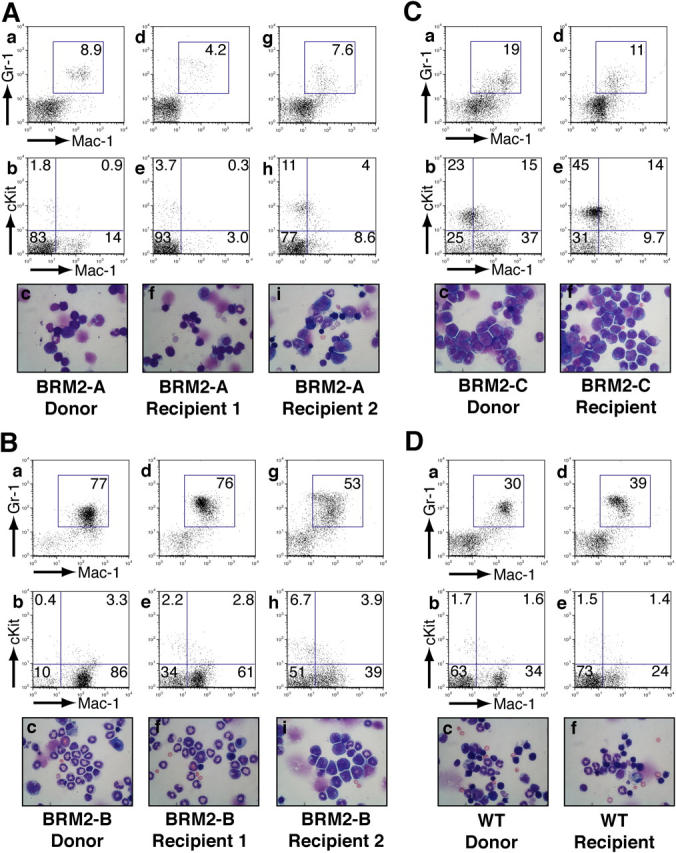
Maintenance and progression of BRM2 phenotypes during BM transplantation. Analysis of recipient BM, from mice transplanted with BM from mice displaying the BRM2-A (A), -B (B), and -C phenotypes (C), as well as control BM (D) (panels d-f). The parallel analysis of the donor BM is shown for comparison (panels a–c). Panels show staining for Mac-1 and Gr-1 (panels a, d, and g); for c-Kit and Mac-1 (panels b, e, and h); and cytospins stained with May-Grünwald-Giemsa (panels c, f, and i). In the case of BRM2-A and BRM2-B, examples are shown of mice in which phenotypic progression toward the BRM2-C phenotype was observed (panels g–i). In all surviving recipients >90% of hematopoietic cells were of donor origin.