Figure 2.
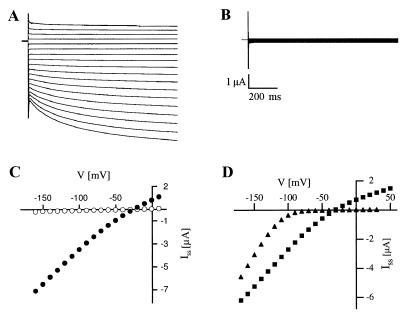
Current–voltage relationship of AKT3 channels. (A) Representative macroscopic recordings of inward and outward currents obtained from AKT3-RNA-injected Xenopus oocytes. From the resting potential (Vr ≈ −20 mV), the membrane voltage was successively changed from +10 mV to −160 mV in 10-mV decrements for a duration of 1 s. The bath solution was composed of 30 mM KCl, 1 mM CaCl2, 2 mM MgCl2, and 10 mM Mes/Tris (pH 5.6). (B) Both the instantaneous and time-dependent current components were blocked in the presence of 30 mM Ba2+. (C) The steady-state currents Iss determined from A (●, control) and B (○, 30 mM Ba2+) were plotted against the membrane voltage. (D) Steady-state currents Iss recorded from AKT3- and KAT1-injected oocytes from the same batch are given as a function of the membrane voltage. In contrast to KAT1 channels (▴), AKT3 channels (■) showed weak rectification. The solution contained 30 mM KCl, 1 mM CaCl2, and 10 mM Mes/Tris (pH 7.2).

