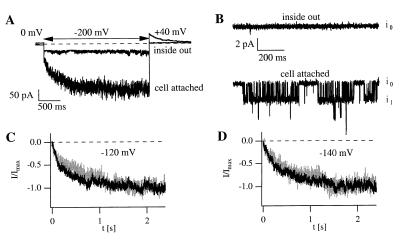
Figure 5.
Comparison of macropatch currents and single-channel fluctuations in cell-attached and excised patches. (A) Time-dependent and instantaneous macropatch currents were observed in response to hyperpolarization. A comparable current response was not observed in the inside-out configuration. (B) Representative channel openings observed in an AKT3-expressing oocyte. Openings and closings were continuously recorded in the cell-attached mode (lower trace) but were not found in the corresponding excised patch (upper trace; V = −140 mV). The labels i0 and i1 indicate the current amplitude when 0 or 1 AKT3 channels are open. (C and D) Activation time course of macropatch currents and assembled single-channel current traces elicited by 2.4-s pulses in the cell-attached mode at −120 mV (C) and at −140 mV (D). Scaled ensemble averages (black traces) of 81 (C) and 67 (D) sweeps and macropatch currents (gray traces) are compared. The solutions contained 140 mM KCl, 2 mM MgCl2, 10 mM Hepes or Tris and were adjusted to pH 7.2 with N-methylglucamine or Mes. The bath solution used for the measurements in A and B and for the macropatch recordings in C also contained 1 mM EGTA.

