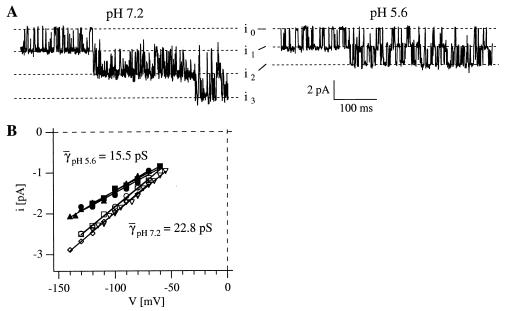
Figure 6.
Extracellular proton effect on the single-channel conductance of AKT3. (A) Single-channel fluctuations recorded in the presence of pH 7.2 (Left) and pH 5.6 (Right) at a voltage of −130 mV. The labels i0–i3 indicate the current amplitude when 0, 1, 2, or 3 AKT3 channels are simultaneously open. The bath and pipette solution contained 140 mM KCl, 2 mM MgCl2, 10 mM Hepes/N-methylglucamine, pH 7.2. In addition, 1 mM EGTA was added to the pipette solution. To adjust the pipette solution to pH 5.6, 10 mM Mes/N-methylglucamine instead of 10 mM Hepes/N-methylglucamine was used. (B) Single-channel amplitudes i were determined for pH 5.6 (closed symbols, n = 3) and pH 7.2 (open symbols, n = 4) from different patches and are shown as a function of voltage. The corresponding single-channel conductances γ were estimated by using linear regression (γ: ● = 15.0 pS; ■ = 15.1 pS; ▴ = 16.3 pS; ○ and □ = 22.6 pS; ▿ = 22.4 pS; ◊ = 23.4 pS). The data points represented by ● and ○ were obtained from the same oocyte but at different external pH (see above). The recordings were performed in the cell-attached configuration. The solutions contained 140 mM KCl, 2 mM MgCl2, 10 mM Hepes/N-methylglucamine or 10 mM Tris/Mes (pH 7.2). To adjust the pipette solution to pH 5.6, we used either 10 mM Mes/N-methylglucamine or 10 mM Mes/Tris. Except for ■, the bath solution also contained 1 mM EGTA.

