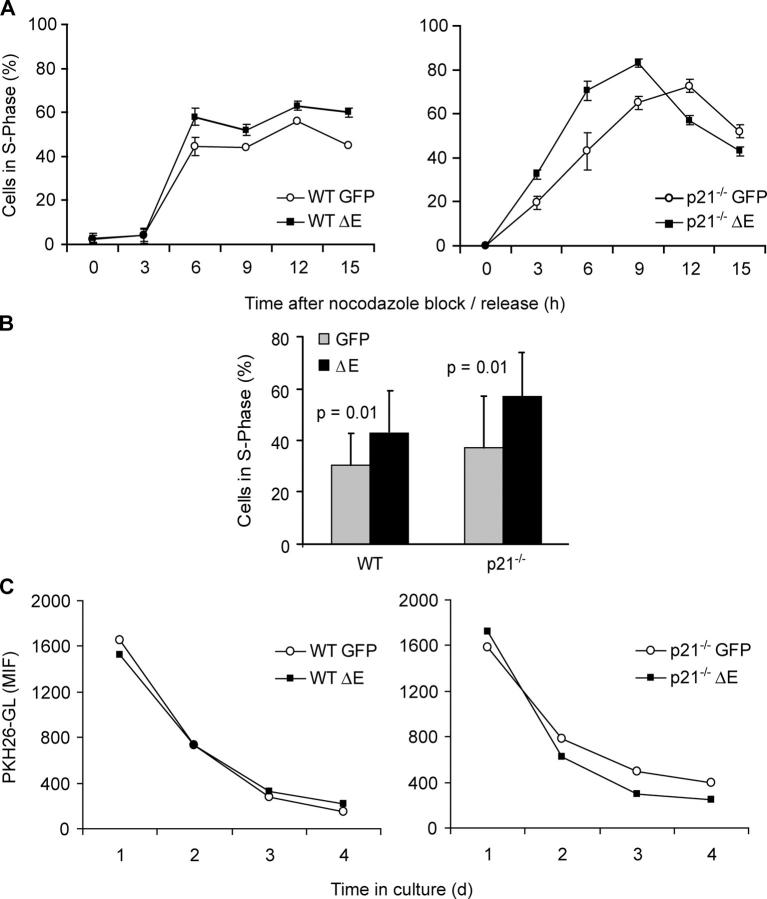
Figure 1.
Biologic effects of N1 activation on 3T3 WT and p21−/− fibroblasts. (A) Percentage of cells in S phase during cell cycle progression. The cell cycle entry of transduced 3T3 cells was evaluated by bromodeoxyuridine incorporation. Values represent an average of duplicate samples in a representative experiment. (B) Bars indicate the average percentage of cells in S phase at 6 h after nocodazole block and release in five independent experiments. The difference between GFP and ΔE populations is statistically significant. (C) Cell division kinetics. Cells stained with PKH26-GL were seeded at low density and analyzed by FACS. The line graphs show a representative experiment. Values indicate PKH 26-GL mean intensity of fluorescence (MIF), decaying over time during cells' exponential growth.

