
Figure 2.
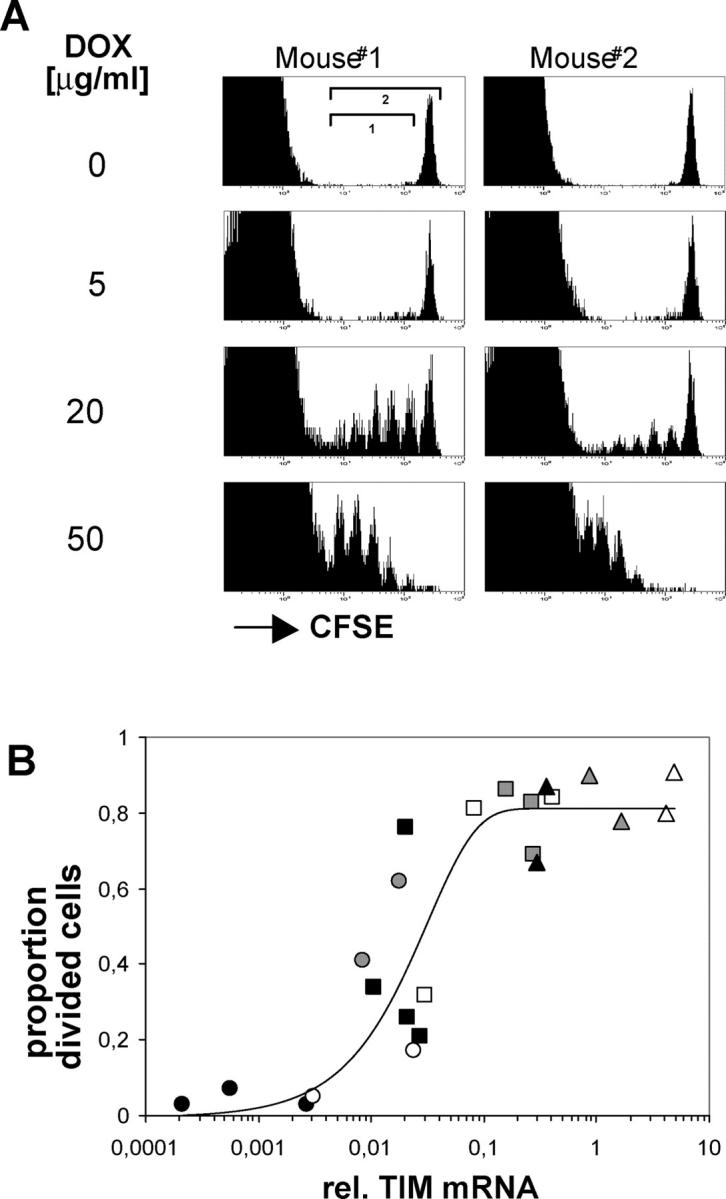
T cell responses vary with antigen dose. (A) Lymph node cells from AND TCR transgenic mice were CFSE labeled and transferred into two double transgenic Ii-rTA+TIM+ recipients that were exposed throughout the experiment to drinking water containing dox at the indicated concentrations. Lymph node cells were analyzed 60 h later. The plots are gated on CD4+ cells. (B) T cell activation threshold in vivo. Lymph nodes from the animals described in A were also analyzed for Ii-rtTA and TIM mRNAs by quantitative RT-PCR. The proportion of divided cells 60 h after transfer was determined by dividing the cell numbers in each peak by 2i, with i being the division number, and dividing this normalized number of divided cells (region 1) by the normalized total (region 2). Each data point stands for one animal, with each symbol representing one dose of dox in the drinking water (closed black circle, 5; open circle, 10; closed gray circle, 15; closed black square, 20; open square, 25; closed gray square, 50; closed black triangle,100; open triangle, 50; closed gray triangle, 200 [μg/ml each]). The data are compiled from three independent experiments.