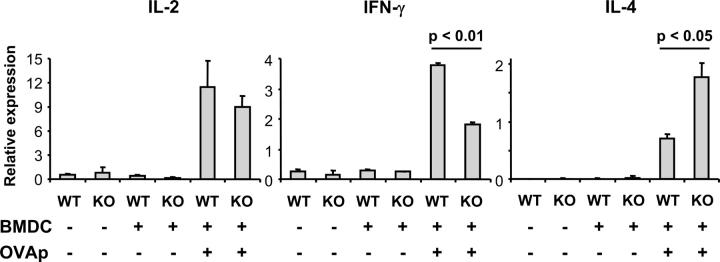
Figure 5.
In vivo Th1 response in B7-DC KO mice. 5 ×10⁶ purified DO11.10 CD4 T cells were adoptively transferred into WT and B7-DC KO mice on d −1 as in Fig. 4. Mice were then immunized with 106 OVA323-339 peptide-pulsed BMDCs on d 0. Peptide-pulsed BMDCs from WT mice were injected into WT mice, and peptide-pulsed BMDCs from B7-DC KO mice were injected into B7-DC KO mice, respectively. On d 5, CD4+KJ1-26+ T cells were sorted out, and their mRNA was extracted. The expression level of each cytokine was detected by real-time RT-PCR, and relative transcripts were calculated by the formula given in Material and methods. Data are representative of three independent experiments.

