Figure 3.
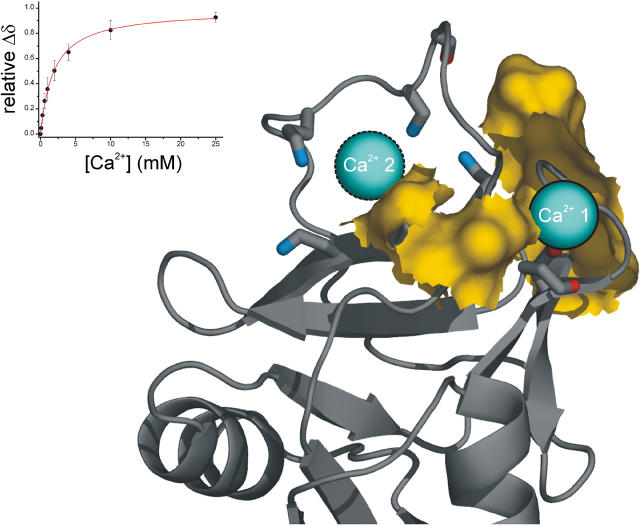
The calcium binding site on CD23. The backbone cartoon of CD23 is shown in gray and the canonical CTLD calcium ions are indicated with blue spheres. Conserved potential chelating atoms are indicated and are colored red for site 1 and blue for site 2. Residues that show large changes in chemical shift (ΔδHN ≥ 0.08 ppm) on the addition of calcium are mapped onto the protein surface and are indicated in yellow. The inset shows the binding isotherm based on change in chemical shift position; results and standard deviations (KD of 1.80 ± 0.15 mM) are from the seven residues that show proton chemical shift changes of ≥0.08 ppm. These results suggest the occupancy of Ca2+ site 1 only.

