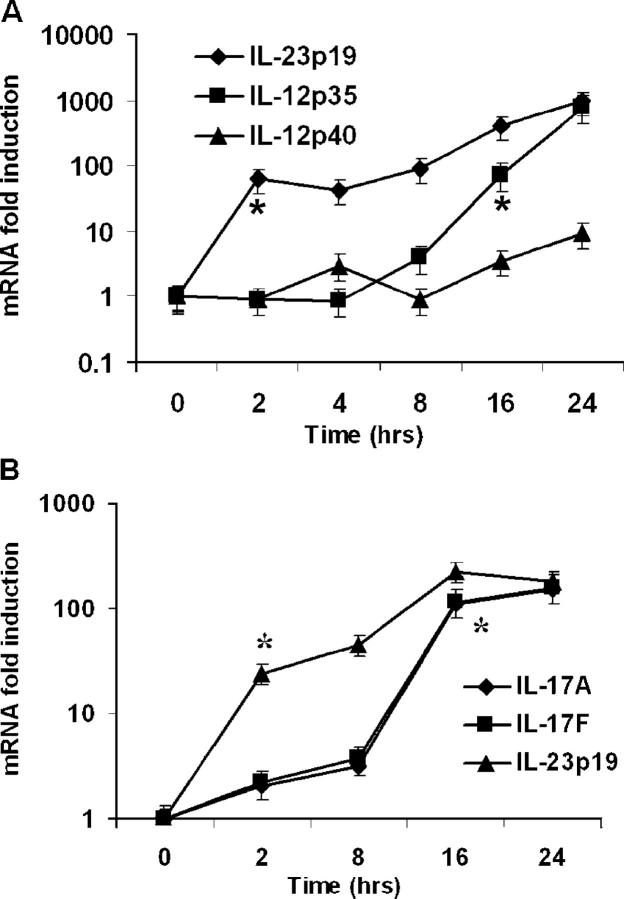
Figure 2.
Cytokine mRNA expression following pulmonary K. pneumoniae infection. Animals were administered 104 CFU bacteria and killed at specified time points. BAL cell pellet and lung homogenate mRNA were assayed via real-time RT-PCR. (A) Increases in BAL cell IL-23 p19, IL-12/23 p40, and IL-12 p35 mRNA expression during infection (n = 4–5 per group). (B) Whole lung tissue IL-23 p19, IL-17, and IL-17F mRNA expression following infection (n = 4–5 per group). Data are normalized for 18s ribosomal RNA content and plotted as fold change over baseline (time 0) expression. *Earliest significant (P < 0.05) increase in expression compared with time zero transcripts. Error bars represent mean ± SD.

