
Figure 2.
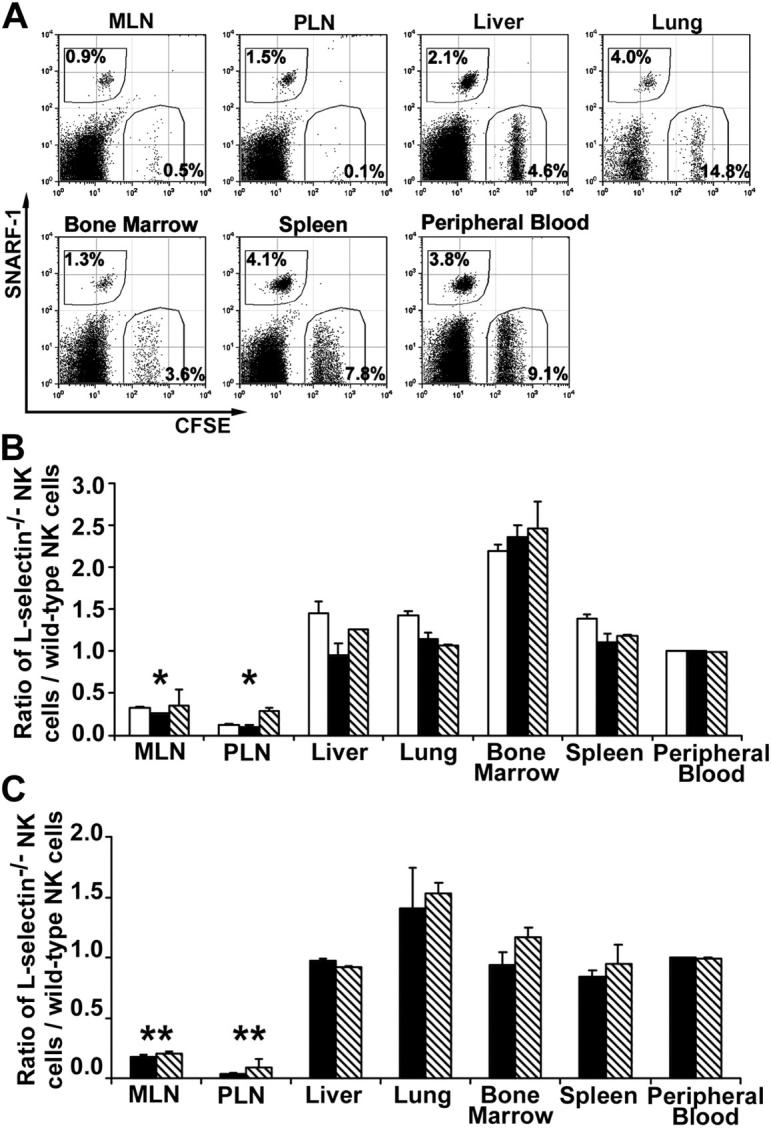
L-selectin–mediated NK cell trafficking to lymph nodes. (A) Wild-type and L-selectin–deficient NK cells were labeled with SNARF-1 and CFSE, respectively, or vice versa. A mixture was injected i.v. into a wild-type C57BL/6 mouse. After 3, 18, or 42 h, various tissues were harvested and single cell suspensions were stained with anti-NK1.1 mAb and subjected to flow cytometric analysis. Only NK1.1+ (gated) lymphocytes are shown 42 h after the transfer. The numbers in dot plots indicate the percentages of transferred NK cells among all NK1.1+ cells. (B) Wild-type NK cells were labeled with CFSE and L-selectin–deficient NK cells were labeled with SNARF-1. The efficiency of NK cells migrating into the tissues was expressed by the ratio of L-selectin–deficient NK cells to wild-type NK cells. White bars, black bars, and diagonally striped bars represent the ratios of 3, 18, and 42 h after the transfer, respectively. The data shown represent the average ± SD of two independent experiments. (C) Wild-type NK cells were labeled with SNARF-1 and L-selectin–deficient NK cells were labeled with CFSE. Black and diagonally striped bars represent the ratios of 18 and 42 h after the transfer, respectively. The data shown represent the average ± SD of three independent experiments. *P < 0.01 and ** P < 0.001 versus the peripheral blood.