Figure 5.

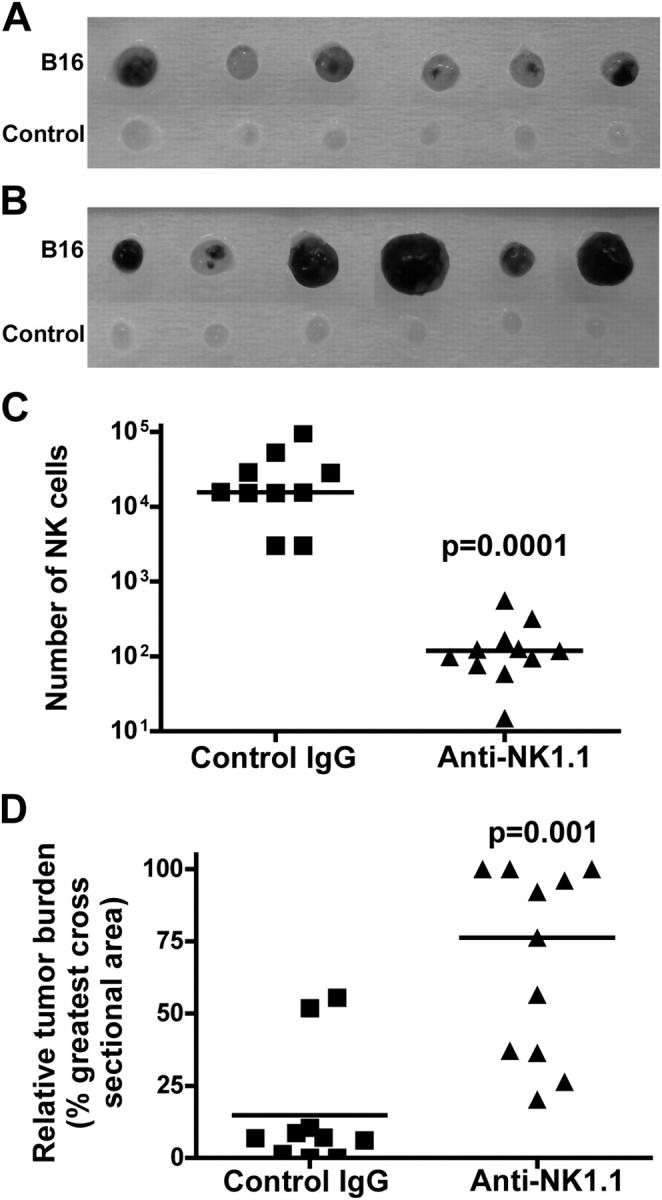
Tumor metastasis in NK cell-depleted Rag-1 −/− mice. (A and B) See Fig. 4 for details. The development of tumor foci in control IgG-treated lymph nodes (A) and anti-NK1.1–treated lymph nodes (B). 6 out of 11 anti-NK1.1–treated and 6 out of 10 control IgG-treated lymph nodes are shown. (C) The number of NK cells and (D) the relative tumor burden in the popliteal lymph nodes bearing B16 tumors. Symbols in C and D represent individual mice. Bars in C and D indicate the median values. p-values are relative to control IgG-treated mice.
