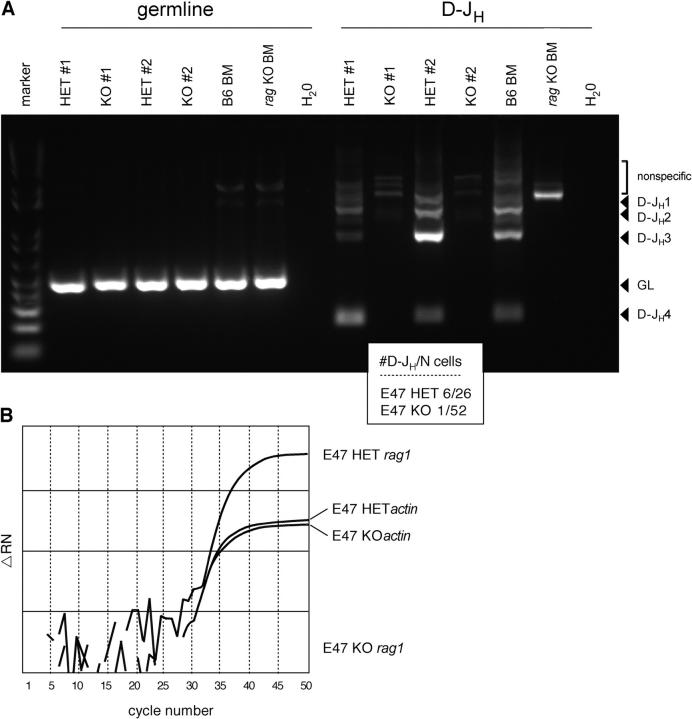
Figure 7.
Recombination at endogenous IgH loci. (A) Bone marrow CLPs as in Fig. 5 D were examined for D-JH rearrangement status at the endogenous IgH locus by PCR. Germline (GL) DNA and rearrangements of D to J1, J2, J3, or J4 is indicated by arrowheads. Data from two independent sorts is shown (E47 heterozygote no. 1 and E47 knockout no. 1, 100 CLPs each; E47 heterozygote no. 2 and E47 knockout no. 2, 150 CLPs each). Rearrangement status of whole bone marrow from wild-type B6 mice and from rag2 knockout mice is provided for comparison. Inset depicts the frequency of CLPs that have detectable D-JH rearrangements as determined by quantitative single cell PCR. (B) rag1 expression was quantified by real-time RT-PCR using 350 cell equivalents of cDNA from CLPs. Expression of rag1 and the reference gene β-actin are shown for equal numbers of CLPs from E47-heterozygous and E47 knockout animals. ΔRN, the fluorescence intensity. Identical results were obtained using cells from at least two independent sorts.

