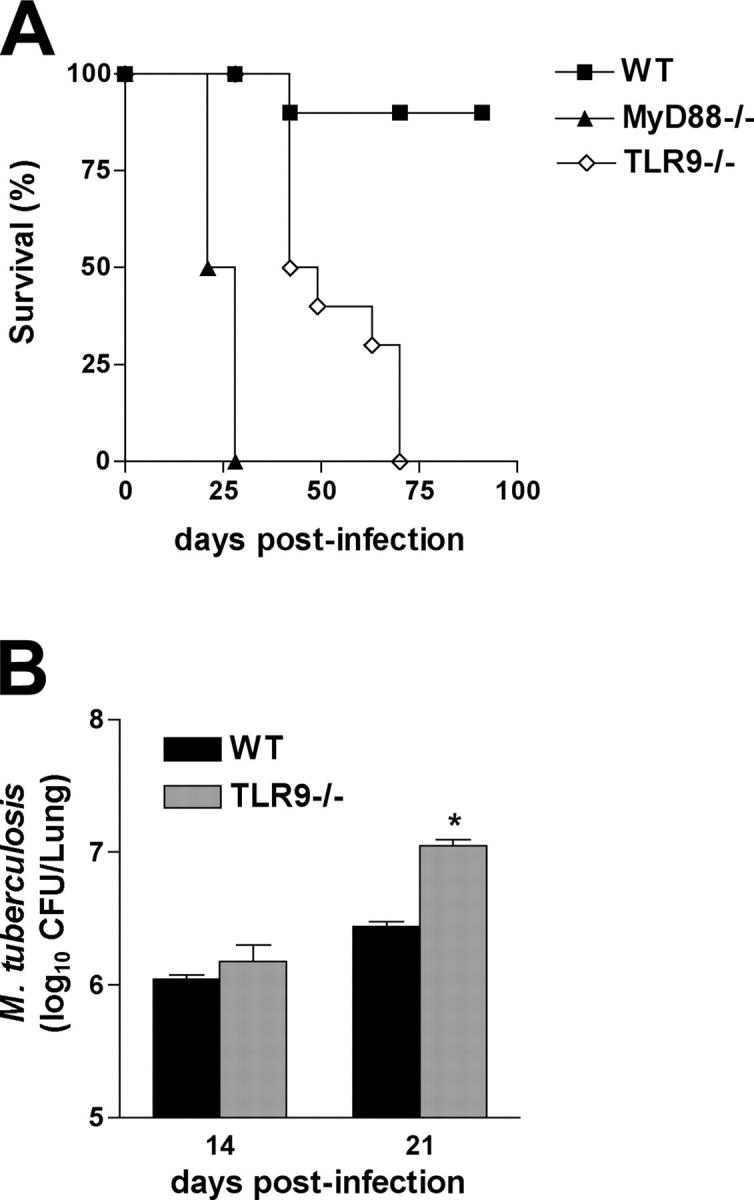
Figure 4.

Increased susceptibility of TLR9−/− mice to high dose M. tuberculosis infection. (A) WT, MyD88-, and TLR9-deficient mice were aerogenically infected with 500 CFUs/mouse (n = 5 animals per group) instead of the usual 50–100 CFU challenge, and survival was monitored. The results shown are representative of two independent experiments. Statistical analysis revealed that the MyD88- and TLR9-deficient mice were significantly more susceptible (P < 0.001) than WT animals and that the survival curve of the TLR9 mice is significantly different (P = 0.0042) from that of the MyD88 animal group. (B) Lungs from infected animals were harvested at 14 and 21 d after infection, and mycobacterial loads were determined. Results are mean ± SE of measurements from four animals. *, a statistically significant difference (P < 0.05) in CFUs between TLR9−/− versus WT mice.
