
Figure 5.
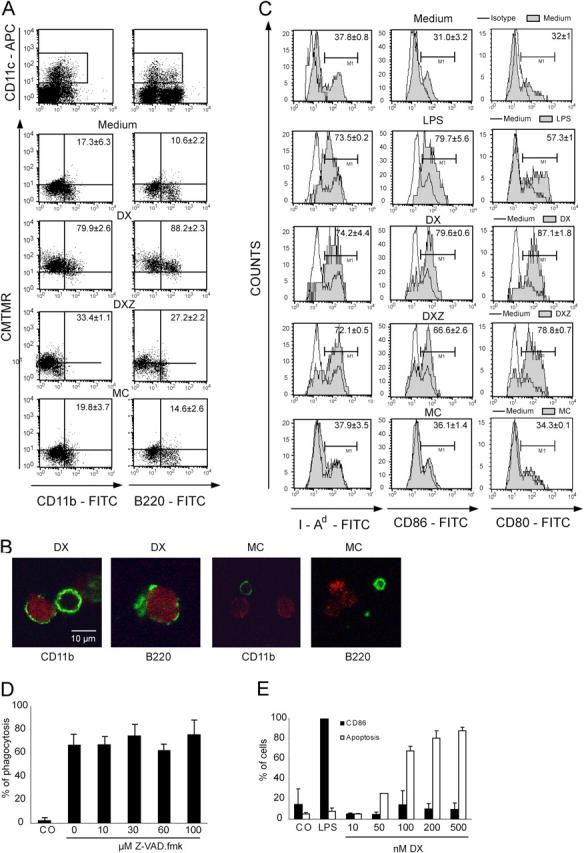
Effect of dying tumor cells on DCs. (A and B) In vitro phagocytosis of the DX-, DXZ-, or MC-treated cells (stained with CMTMR) by spleen DCs from Flt3L-injected mice. Representative FACS diagrams are depicted in A, and confocal images of dying tumor cells (red) phagocytosed by purified DC subsets (green) are shown in B. (C) DC maturation of splenic DCs induced by LPS (positive control) and dying or dead CT26 cells. Percentage values in A and C are means of three independent determinations ± SD. (D) Failure of Z-VAD-fmk to inhibit the phagocytosis of DX-treated CT26 cells by DCs. DCs generated as in D were incubated for 90 min with a twofold excess of DX-treated CT26 cells in the presence of the indicated concentrations of Z-VAD-fmk, and the percentage of DCs containing dying or dead CT26 cells was determined as in A. (E) Failure of DX to activate DCs. Bone marrow–derived DCs were activated with LPS as a positive control or with the indicated concentration of DX, and the frequency of apoptotic cells (annexin V+) and CD86+ cells was determined by immunofluorescence and cytofluorometric analysis. Percentage values in A and C–E are means of three independent determinations ± SD.